Tại bài viết này, IELTS CITY sẽ tổng hợp các bài mẫu IELTS Writing Task 1 band 7.5+ cho từng dạng được biên soạn bởi IELTS CITY. Các bạn hãy cùng tham khảo nhé!
Xem lại:
Bài mẫu IELTS Writing Task 1 dạng Line Graph
Xem lại: Cách viết Line Graph
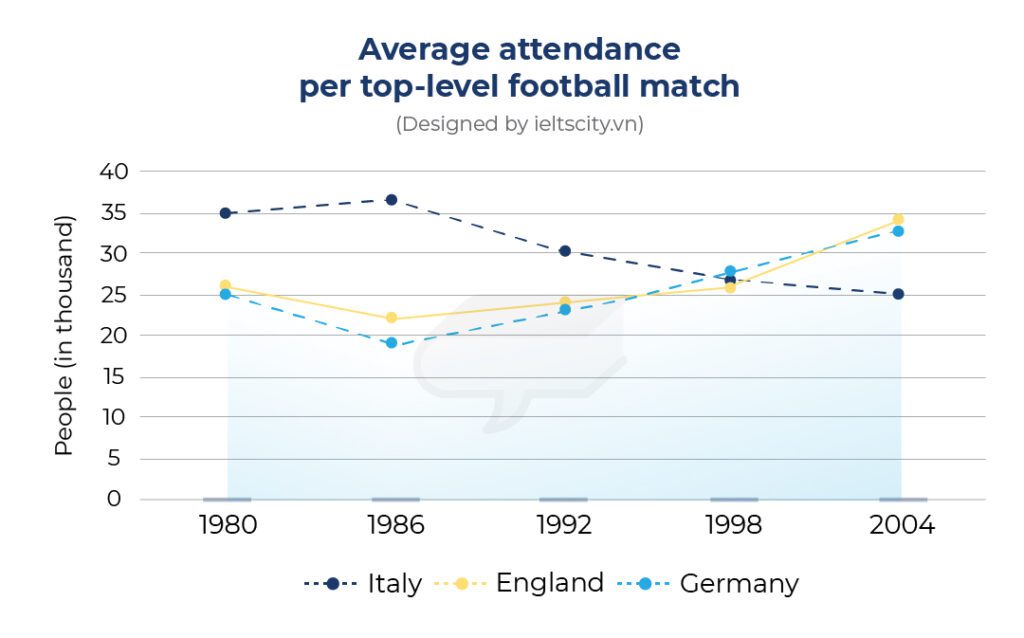
The graph below shows the average number of people attending top-level football matches in three European countries from 1980 to 2004. Summarize the information by selecting and reporting the main features, and make comparisons where relevant.
Dàn ý:
Introduction: Paraphrase lại đề bài
- Briefly describe the chart’s content: average attendance at top-level football matches in three countries.
- State the time period: from 1980 to 2004.
Overview:
- Summarize the overall trend: attendance generally declined for all three countries.
- Highlight a key contrast: Germany experienced a significant rise in the late 1990s.
Body Paragraphs:
- Paragraph 1: Focus on Italy and England, highlighting the decreasing trends in their attendance figures.
- Paragraph 2: Describe the changes in Germany’s attendance, emphasizing the significant increase from 1998 to 2004.
Hướng dẫn: Cách viết IELTS Writing Task 1
Bài mẫu
The line chart illustrates the average attendance at top-level football matches in Italy, England, and Germany between 1980 and 2004. The figures are presented in thousands of people.
Overall, the chart demonstrates a general downward trend in attendance for all three countries. However, a notable exception is Germany, which experienced a significant surge in spectators from the late 1990s onward.
In 1980, Italy had the highest attendance figures, reaching around 35,000, while England had slightly lower attendance at approximately 26,000. Both countries witnessed a gradual decline in attendance over the next two decades. By 2004, attendance in Italy had fallen to around 25,000, and in England, it had dropped to 34,000.
Germany, on the other hand, experienced a contrasting trend. While their attendance was initially lower than both Italy and England, it remained relatively stable until 1998. After 1998, attendance rose steadily, culminating in a significant increase to 34,000 by 2004. This suggests that Germany experienced a revival in the popularity of football during the late 1990s and early 2000s.
Đăng ký nhận tư vấn miễn phí
Ưu đãi học phí lên đến 45%
& Cơ hội nhận học bổng trị giá 3.000.000 VNĐNamePhoneCourseKhóa học mà bạn quan tâm:Khóa học IELTS Cấp tốcKhóa học IELTS OnlineKhóa học IELTS Cấp 2-3Khóa học IELTS 1 kèm 1Khóa học IELTS GeneralKhóa học IELTS cho người mất gốcTôi cần được tư vấn khoá học
Từ vựng
- Illustrate (v): Minh họa
- Attendance (n): Sự tham dự
- Downward (adj): Giảm dần
- Notable (adj): Đáng chú ý
- Surge (n): Sự gia tăng đột biến
- Gradual (adj): Dần dần
- Culminate (v): Kết thúc, đạt đỉnh điểm
- Revival (n): Sự phục hồi, hồi sinh
- Popularity (n): Sự phổ biến
Bản dịch
Biểu đồ đường minh họa lượng khán giả trung bình tại các trận đấu bóng đá cấp cao ở Ý, Anh và Đức từ năm 1980 đến năm 2004. Các con số được thể hiện theo hàng ngàn người.
Tổng thể, biểu đồ cho thấy xu hướng giảm chung về lượng khán giả ở cả ba quốc gia. Tuy nhiên, một ngoại lệ đáng chú ý là Đức, quốc gia đã chứng kiến sự gia tăng đáng kể về số lượng khán giả từ cuối những năm 1990 trở đi.
Năm 1980, Ý có lượng khán giả cao nhất, đạt khoảng 35.000 người, trong khi Anh có lượng khán giả thấp hơn một chút, khoảng 26.000 người. Cả hai quốc gia đều chứng kiến sự suy giảm dần dần về lượng khán giả trong hai thập kỷ tiếp theo. Đến năm 2004, lượng khán giả ở Ý đã giảm xuống khoảng 25.000 người, và ở Anh, nó đã giảm xuống còn 34.000 người.
Ngược lại, Đức lại trải qua một xu hướng tương phản. Mặc dù lượng khán giả của họ ban đầu thấp hơn cả Ý và Anh, nhưng nó vẫn tương đối ổn định cho đến năm 1998. Sau năm 1998, lượng khán giả tăng đều đặn, đạt đỉnh điểm là sự gia tăng đáng kể lên 34.000 người vào năm 2004. Điều này cho thấy Đức đã trải qua sự hồi sinh về sự phổ biến của bóng đá trong cuối những năm 1990 và đầu những năm 2000.
Tham khảo thêm các bài mẫu dạng Line Graph:
Bài mẫu IELTS Writing Task 1 dạng Bar Chart
Xem lại: Cách viết Bar Chart
Đề bài:
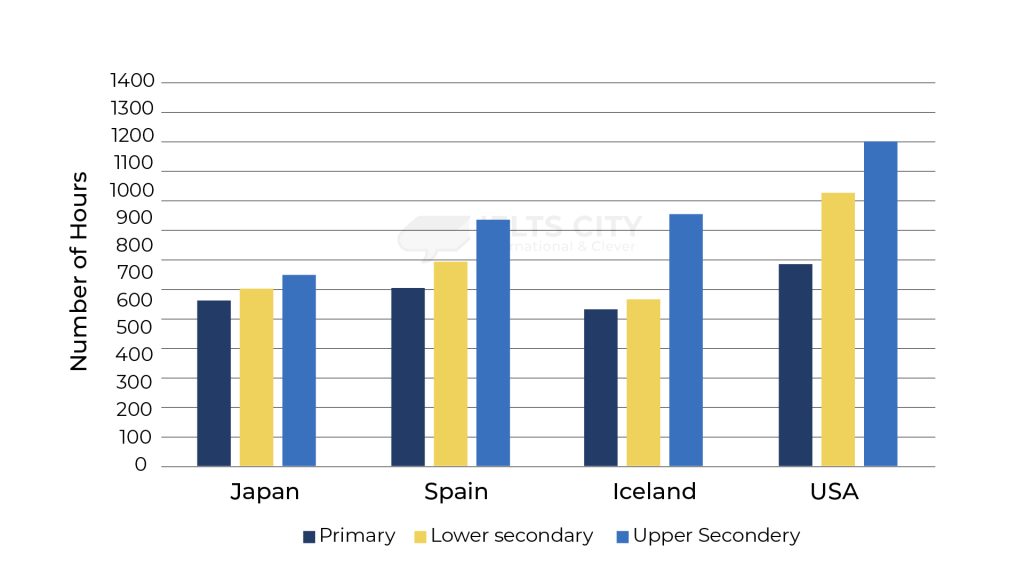
The bar chart below shows the number of hours each teacher spent teaching in different schools in four different countries in 2001. Summarise the information by selecting and reporting the main features, and make comparisons where relevant.
Dàn bài:
- Introduction: Paraphrase đề bài.
- The bar charts below → The bar chart (bỏ ‘below’).
- Shows → compares.
- The number of hours each teacher spent teaching → the average working hours.
- In different schools → of elementary, middle, and high school teachers.
- In four different countries → in four distinct countries.
- In 2001 → giữ nguyên.
⇒ The bar chart compares the average working hours of elementary, middle, and high school teachers in four distinct countries in 2001.
- Overview: Mô tả khái quát biểu đồ bằng cách nhận xét những đặc điểm nổi bật nhất (3–4 ý).
- Giáo viên ở Hoa Kỳ làm việc nhiều giờ hơn so với giáo viên ở Nhật Bản, Tây Ban Nha và Iceland.
- Giáo viên trung học phổ thông phải làm nhiều giờ hơn.
- (Giáo viên trung học) trái ngược hoàn toàn với giáo viên tiểu học.
- Details: Mô tả một cách cụ thể, dẫn số liệu và so sánh khi cần thiết.
- Paragraph 1: Giáo viên trung học phổ thông. So sánh giữa các nước. Dẫn số liệu ở bậc phổ thông của mỗi nước.
- Paragraph 2: Giáo viên tiểu học. Xếp hạng các nước và dẫn số liệu tương ứng.
- Paragraph 3: Giáo viên trung học cơ sở. So sánh giữa các nước. Dẫn số liệu của mỗi nước.
Bài mẫu:
The bar chart compares the average working hours of elementary, middle, and high school teachers in four distinct countries in 2001.
In general, it is apparent that teachers in the USA worked longer hours than those in Japan, Spain, and Iceland. Another salient feature is that high school teachers undertook more hours of work, in complete contrast to primary school teachers.
As mentioned earlier, the highest sum of working hours was recorded among high school teachers in the USA, at 1,200 hours, compared to those teaching the same level in Japan (650 hours), Spain, and Iceland (around 850 hours).
Moreover, the length of work for primary school teachers in all four countries was the shortest, especially in Iceland (over 500 hours), followed by Japan and Spain (about 550 and 600 hours, respectively), while the USA, again, occupied the top rank (almost 700 hours).
American middle school teachers also worked a larger amount of time (above 1,000 hours) than Spanish and Japanese teachers of the same level (700 and 550 hours, respectively). Most notably, Icelandic secondary school teachers worked half as long as Americans.
Từ vựng:
- Apparent [adj]: easy to see or understand (rõ ràng).
- Salient /ˈseɪliənt/ [adj, only before noun]: most important or easy to notice (nổi bật).
→ Salient feature.
- Undertake [v]: to make yourself responsible for something and start doing it (đảm nhận).
- Contrast [n]: a difference between two or more people or things that you can see clearly when they are compared or put close together (sự đối lập).
→ In (complete) contrast to somebody/something.
- Sum [n]: the number you get when you add two or more numbers together (tổng).
→ The sum of something.
- Respectively [adv]: in the same order as the people or things already mentioned (lần lượt, tương ứng).
- Các cách paraphrase cụm từ ‘the number of hours each teacher spent teaching’:
- the working hours of teachers
- how many hours teachers worked
- the length of work for teachers
- Các cách so sánh số giờ làm việc của giáo viên:
- So sánh hơn:
- Teachers in the USA worked longer hours than those in Japan, Spain, and Iceland.
- High school teachers undertook more hours of work than middle school and primary school teachers.
- American middle school teachers also worked a larger amount of time, compared to those teaching the same level in Japan, Spain and Iceland.
- So sánh nhất:
- The highest sum of working hours was recorded among high school teachers in the USA.
- The length of work for primary school teachers in all four countries was the shortest.
- So sánh bằng:
- Middle school teachers in Japan worked almost as long as those in Spain.
- So sánh gấp lần:
- Icelandic middle school teachers worked half as long as Americans. (Or, American middle school teachers worked twice as long as Icelanders.)
- So sánh hơn:
Dịch bài mẫu:
Biểu đồ thanh so sánh số giờ làm việc của giáo viên tiểu học, trung học cơ sở và trung học phổ thông ở bốn quốc gia khác nhau vào năm 2001.
Nhìn chung, rõ ràng là giáo viên ở Hoa Kỳ làm việc nhiều giờ hơn so với giáo viên ở Nhật Bản, Tây Ban Nha và Iceland. Một đặc điểm nổi bật nữa là giáo viên trung học phổ thông phải làm nhiều giờ hơn, trái ngược hoàn toàn với giáo viên tiểu học.
Như đã đề cập trước đó, tổng số giờ làm việc cao nhất được ghi nhận trong vòng các giáo viên trung học phổ thông ở Hoa Kỳ, ở mức 1.200 giờ, so với những giáo viên dạy cùng cấp độ ở Nhật Bản (650 giờ), Tây Ban Nha và Iceland (khoảng 850 giờ).
Hơn nữa, tổng thời gian làm việc của giáo viên tiểu học ở cả bốn quốc gia đều ngắn nhất, đặc biệt là ở Iceland (hơn 500 giờ), tiếp theo là Nhật Bản và Tây Ban Nha (tương ứng khoảng 550 và 600 giờ), trong khi Hoa Kỳ lại chiếm vị trí hàng đầu (gần 700 giờ).
Giáo viên trung học cơ sở ở Mỹ cũng làm việc với thời lượng lớn hơn (trên 1.000 giờ) so với giáo viên người Tây Ban Nha và Nhật Bản cùng cấp độ (lần lượt là 700 và 550 giờ). Đáng chú ý nhất, giáo viên trung học ở Iceland làm việc bằng một nửa thời gian so với giáo viên Mỹ.
Bài mẫu IELTS Writing Task 1 dạng Pie Chart
Xem lại: Cách viết Pie Chart
Đề bài:
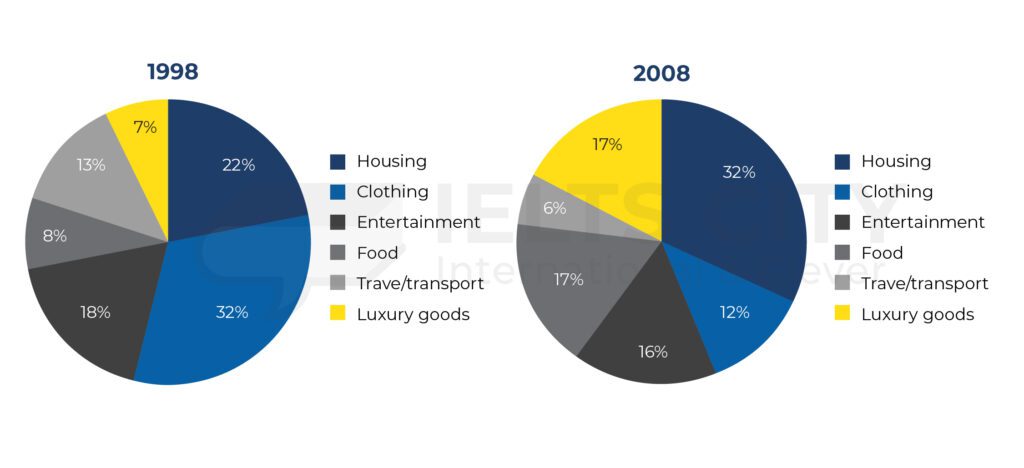
The charts below show the proportion of people’s spending on different commodities and services in a particular European country in 1998 and in 2008.
Dàn bài:
- Introduction: Giới thiệu tỷ lệ chi tiêu cho các dịch vụ và sản phẩm của người dân ở một quốc gia châu Âu cụ thể vào năm 1958 và 2008
- Overview: Đề cập đến những thay đổi đáng chú ý qua từng năm.
- Body 1: So sánh tỷ lệ chi tiêu cho:
- Nhà cửa và Quần áo
- Vật dụng sang trọng
- Body 2: So sánh những dữ liệu còn lại:
- Giải trí
- Thực phẩm
- Việc di chuyển
Bài mẫu:
The provided pie charts offer a comparison of the spending habits of Europeans on five distinct categories of goods over a span of two years.
A general observation reveals an increasing trend in the expenditure on home appliances, luxury items, and food. Conversely, a decrease in spending is noted for clothing and transportation. Interestingly, the expenditure on clothing mirrors that of housing across different years.
Delving deeper into the data, in 1998, expenditure on clothing was marginally higher than that on entertainment and housing, at 18% and 22% respectively. However, by 2008, housing expenditure surpassed that of clothing, which saw a significant rise to 32%. Additionally, spending on luxury items witnessed a substantial increase from 7% to 17% over the same period.
Examining the remaining categories, in 1998, the percentages for entertainment, food, and transportation stood at 13%, 32%, and 8% respectively. While expenditure on transportation showed an upward trend, a considerable decrease was observed in the other categories. Specifically, spending on transportation increased by 9% to reach 17%, whereas there was a decline of 20% and 7% in food and entertainment respectively by 2008.
Từ vựng:
- distinct [adj]: rõ ràng
- a span of [n]: một khoảng thời gian
- reveals [v]: tiết lộ
- Conversely [adv]: ngược lại
- mirrors [v]: phản ánh
- Delving deeper into [v]: đi sâu vào
- substantial [adj]: đáng kể, lớn lao
- Examining [v]: xem xét
Dịch bài mẫu:
Các biểu đồ tròn cung cấp một so sánh về thói quen tiêu dùng của người châu Âu đối với năm nhóm hàng khác biệt trong một khoảng thời gian là hai năm.
Một quan sát tổng quan cho thấy xu hướng gia tăng về chi tiêu cho thiết bị gia đình, hàng xa xỉ và thực phẩm. Ngược lại, có sự giảm đi trong việc chi tiêu cho quần áo và giao thông. Đáng chú ý, chi tiêu cho quần áo tương tự như chi phí cho nhà ở trong các năm khác nhau.
Mở rộng hơn vào dữ liệu, vào năm 1998, chi tiêu cho quần áo cao hơn một chút so với chi phí cho giải trí và nhà ở, lần lượt là 18% và 22%. Tuy nhiên, đến năm 2008, chi phí cho nhà ở vượt mặt chi phí cho quần áo, với một sự tăng đáng kể lên 32%. Ngoài ra, chi tiêu cho hàng xa xỉ cũng tăng mạnh từ 7% lên 17% trong cùng thời kỳ. Xem xét các hạng mục còn lại, vào năm 1998, tỷ lệ phần trăm cho giải trí, thực phẩm và giao thông là 13%, 32% và 8% tương ứng. Trong khi chi phí cho giao thông có xu hướng tăng, đã có một sự giảm đáng kể đối với các hạng mục khác. Cụ thể, chi tiêu cho giao thông tăng 9% để đạt 17%, trong khi có một giảm điểm lớn là 20% và 7% đối với thực phẩm và giải trí lần lượt vào năm 2008.
Bài mẫu IELTS Writing Task 1 dạng Table
Xem lại: Cách viết Table
Đề bài:
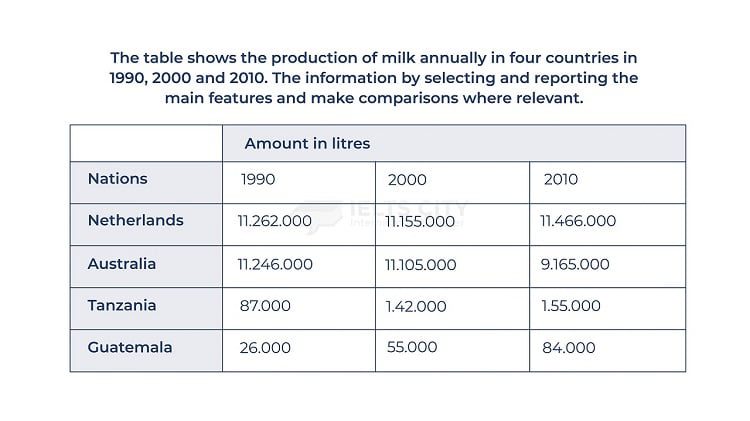
The table shows the production of milk annually in four countries in 1990, 2000 and 2010. Summarize the information by selecting and reporting the main features and make comparisons where relevant.
Dàn bài:
- Introduction: Paraphrase đề bài.
- The table shows → The table compares.
- The production of milk annually → in terms of annual milk production.
- In four countries → four nations.
- in 1990, 2000, and 2010 → giữ nguyên.
⇒ The table compares four nations in terms of annual milk production in 1990, 2000, and 2010.
- Overview: Mô tả khái quát biểu đồ bằng cách nhận xét những đặc điểm nổi bật nhất (3–4 ý).
- (1) Hà Lan không tăng đáng kể, mặc dù (2) sản lượng cao nhất.
- (3) Úc giảm, trong khi (4) Tanzania và Guatemala tăng mạnh.
- Details: Mô tả một cách cụ thể mỗi đối tượng, dẫn số liệu và so sánh khi cần thiết.
- Paragraph 1: Hà Lan và Úc.
- Paragraph 2: Tanzania và Guatemala.
Bài mẫu:
The table compares four nations in terms of annual milk production in 1990, 2000, and 2010.
In general, the Netherlands does not show a remarkable increase in its production of milk, although this country outdid the others. Noticeably, while the data for Australia displays a decline, that for Tanzania and Guatemala indicates extensive increases.
As mentioned, the Netherlands, albeit the largest milk producer, did not grow significantly. The figures record that it dropped by 107,000 liters in the first decade, and although it climbed back to 11,466,000 liters in the following decade, the gap between the initial and final levels is relatively insignificant. Starting at roughly the same level as the Netherlands in 1990, Australia even plummeted by approximately 2,000,000 liters by 2010.
Tanzania and Guatemala both show a rise, but while figures for the former increased nearly twofold (87,000–155,000 liters), those for the latter almost quadrupled (26,000–84,000 liters). Despite that, Guatemala still remained in the lowest rank during the given period.
Từ vựng:
- In terms of something [conj.]: used to show what aspect of a subject you are talking about or how you are thinking about it (về cái gì).
- Outdo somebody/something [v]: to do more or better than somebody else (vượt trội hơn ai/cái gì).
- Decline [n]: a continuous decrease in the number, value, quality, etc. of something (sự suy giảm).
- Extensive [adj]: covering a large area; great in amount (rộng, lớn, mạnh).
- Albeit [conj.]: although (mặc dù). Albeit + Noun/Adj/Adv.
- Initial [adj, only before noun]: happening at the beginning; first (ban đầu).
- Roughly [adv]: approximately but not exactly (gần như, khoảng).
- Plummet [v]: to fall suddenly and quickly from a high level or position (giảm mạnh).
- Twofold [adv]: twice as much or as many (gấp đôi).
→ -fold [suffix]: (in adjectives and adverbs) multiplied by; having the number of parts mentioned, e.g. threefold, fourfold, tenfold, etc. (gấp bao nhiêu lần).
- Quadruple [v]: to become four times bigger; to make something four times bigger (tăng gấp bốn lần).
Dịch bài mẫu:
Bảng so sánh bốn quốc gia về sản lượng sữa hàng năm vào năm 1990, 2000 và 2010.
Nhìn chung, Hà Lan không cho thấy sự gia tăng đáng kể trong sản xuất sữa, mặc dù quốc gia này vượt trội so với các quốc gia khác. Đáng chú ý, trong khi dữ liệu của Úc cho thấy sự suy giảm, dữ liệu của Tanzania và Guatemala cho thấy sự gia tăng mạnh mẽ.
Như đã đề cập, Hà Lan, mặc dù là nhà sản xuất sữa lớn nhất, nhưng tăng trưởng không đáng kể. Các số liệu ghi lại rằng nó đã giảm 107.000 lứa trong thập kỷ đầu tiên và mặc dù nó đã tăng trở lại 11.466.000 lứa trong thập kỷ tiếp theo, nhưng khoảng cách giữa mức ban đầu và mức cuối cùng là tương đối không đáng kể. Bắt đầu ở mức tương đương với Hà Lan vào năm 1990, Úc thậm chí còn giảm mạnh khoảng 2.000.000 lứa vào năm 2010.
Tanzania và Guatemala đều cho thấy sự gia tăng, nhưng trong khi số liệu của Guatemala và Guatemala tăng gần gấp đôi (87.000–155.000 lứa), thì những con số này của Guatemala tăng gần gấp bốn lần (26.000–84.000 lứa). Mặc dù vậy, Guatemala vẫn ở thứ hạng thấp nhất trong khoảng thời gian nhất định.
Bài mẫu IELTS Writing Task 1 dạng Map
Xem lại: Cách viết Map
Đề bài:
The maps show the changes in the plan of a dock between 1980 and today. Summarize the information by selecting and reporting the main features and make comparisons where relevant.
Dàn bài:
- Introduction: Paraphrase đề bài.
- The maps → giữ nguyên.
- Show → depict.
- The changes in the plan of a dock between 1980 and today → how the layout of a dock has developed since 1980.
- Overview: Trình bày những đặc điểm nổi bật.
- Bến tàu đã trải qua những thay đổi mạnh mẽ.
- Từ một địa điểm chỉ dành riêng cho mục đích vận chuyển, nó trở thành một địa điểm du lịch.
- Details: Trình bày cụ thể những sự thay đổi đã diễn ra.
- Paragraph 1: Sự chuyển đổi mục đích sử dụng của các cơ sở vật chất liên quan đến giao thông.
- Paragraph 2: Sự xây dựng những cơ sở vật chất mới.
- Paragraph 3: Sự phát triển những cơ sở hạ tầng.
Bài mẫu:
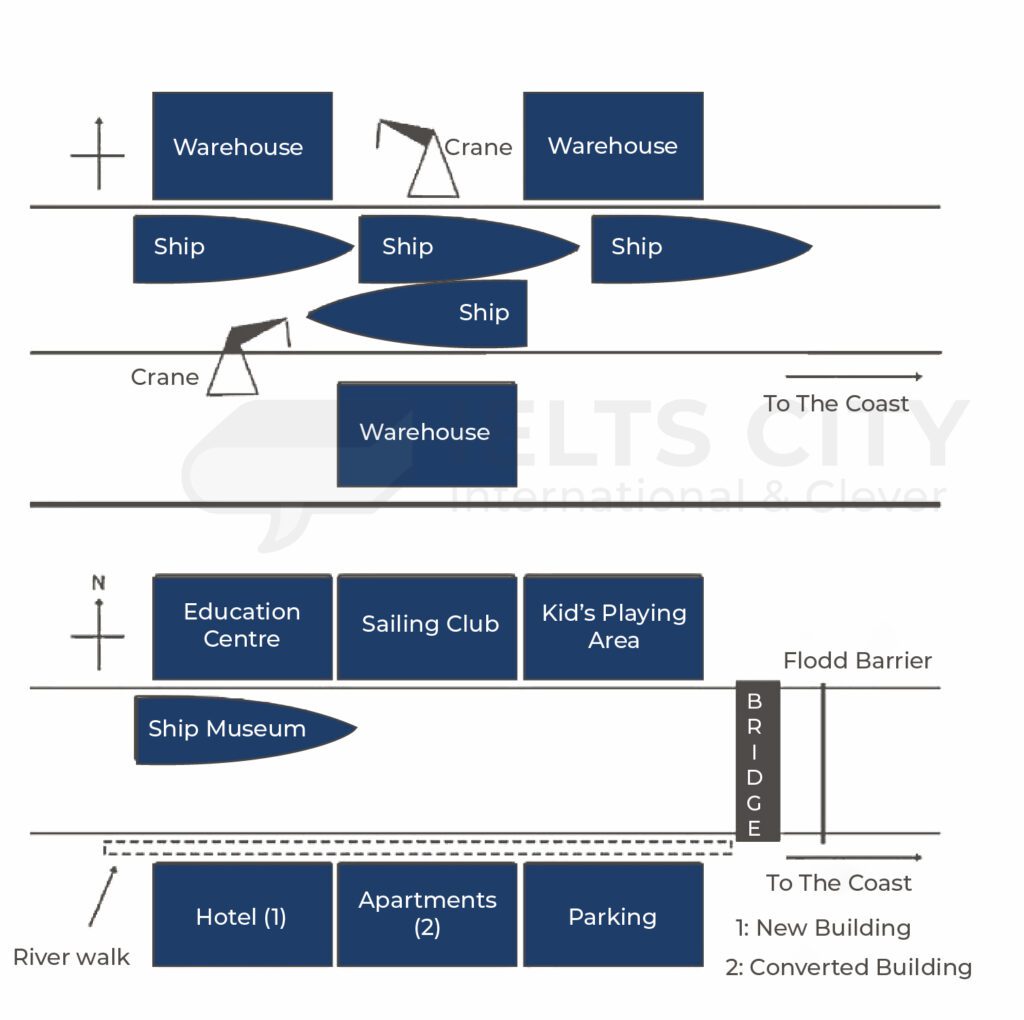
The maps depict how the layout of a dock has developed since 1980.
It is obvious that the dock has experienced major changes, which have transformed it from a location dedicated exclusively to transport purposes to a tourist site.
One of the most striking alterations is the conversion of the ship docking area into a ship museum, which clearly shows that the dock has now performed a completely different function. Another noteworthy feature is the demolition of the warehouses and the removal of the cranes to accommodate a new education center, a playing area for children, and an apartment block.
Besides the replacement of all former transport-related facilities with amenities for visitors, the dock has also seen a significant number of newly constructed buildings, including a sailing club on the northern bank of the river, as well as a hotel and a parking lot on the southern side.
Finally, there have also been infrastructural developments, such as a river walk in the south, a bridge crossing the river, and a flood barrier in the joint area with the coast.
Từ vựng:
- Layout [n]: the way in which the parts of something such as the page of a book, a website, a garden or a building are arranged (cách bố trí).
- Transform something/somebody (from something into something) [v]: to change the form of something; to change in form (biến đổi).
- Alteration [n]: a change to something that makes it different (sự thay đổi).
- Conversion (from something) (into/to something) [n]: the act or process of changing something from one form, use or system to another (sự chuyển đổi).
- Demolition [n]: the act of pulling or knocking down a building (sự phá dỡ).
- Accommodate somebody/something [v]: to provide enough space for somebody/something (chứa; tạo không gian).
- Amenity [n]: a feature or service that makes a place pleasant, comfortable or easy to live in (tiện ích).
- Infrastructural [adj]: connected with the basic systems and services that are necessary for a country or an organization to run smoothly, for example buildings, transport and water and power supplies (liên quan đến cơ sở hạ tầng).
Dịch bài mẫu:
Các bản đồ mô tả cách thức bố trí của một bến tàu đã phát triển như thế nào kể từ năm 1980.
Rõ ràng là bến tàu đã trải qua những thay đổi mạnh mẽ, khiến nó từ một địa điểm chỉ dành riêng cho mục đích vận chuyển trở thành một địa điểm du lịch.
Một trong những thay đổi nổi bật nhất là việc chuyển hóa khu vực tàu cập bến thành một bảo tàng về tàu thuyền, điều này cho thấy rõ bến tàu giờ đây đã thực hiện một chức năng hoàn toàn khác. Một đặc điểm đáng chú ý khác là việc phá dỡ các nhà kho và dỡ bỏ các cần cẩu để làm một trung tâm giáo dục mới, khu vui chơi cho trẻ em và khu chung cư.
Bên cạnh việc thay thế tất cả các cơ sở vật chất liên quan đến giao thông trước đây bằng các tiện ích dành cho du khách, bến tàu còn có một số lượng đáng kể các tòa nhà mới được xây dựng, bao gồm câu lạc bộ chèo thuyền ở bờ bắc con sông, cũng như một khách sạn và một bãi đậu xe trên bờ nam.
Cuối cùng, cũng đã có những phát triển về cơ sở hạ tầng như đường đi bộ trên sông ở phía nam, chiếc cầu băng qua sông và rào chắn lũ ở khu vực nối liền với bờ biển
Bài mẫu IELTS Writing Task 1 dạng Process
Xem lại: Cách viết Process
Đề bài
The diagram below shows how oil is expected in use of production of perfume.
Dàn bài
- Introduction: Giới thiệu processes.
- Overview: Có 4 bước chính để tạo ra thành phẩm bao gồm đun nước, hóa hơi, ngưng tụ và chiết xuất thành phẩm.
- Body 1: Bắt đầu từ việc đun nước trong nồi hơi kín để cho ra hơi nước, hơi nước sẽ đi theo ống dẫn đến 1 bể chứa lớn nơi chứa cây có tinh dầu thơm. Sau đó hơi nước sẽ làm tiếp tục làm nóng cây tinh dầu ở phía dưới để cho ra tinh dầu hóa hơi.
- Body 2: ở những bước tiếp theo, tinh dầu và hơi nước sẽ đi qua bình ngưng để tách nước và tinh dầu ra phục vụ cho những mục đích khác nhau của khách hàng.
Bài mẫu:
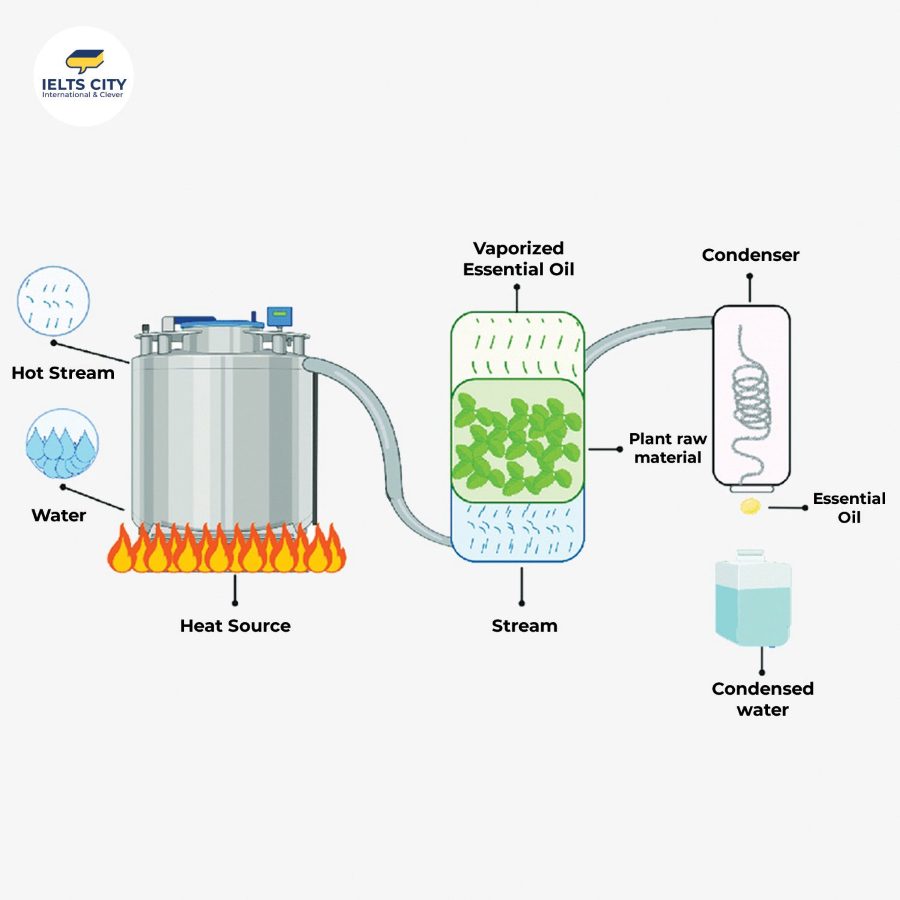
The diagram shows the process of producing perfume from oil. In general, there are four main steps, involving heating, vaporizing, condensing and extracting.
At the beginning of the process, water is heated by fire inside an airtight container until it transforms into steam. Then the steam follows a pipe which leads to a large tank. In the next step, fresh herbal ingredients are placed in the middle compartment of a large cylinder. The bottom of this cylinder is connected with the steam pipe while its top is linked to another pipe. As the steam enters the container, it goes through the place where the ingredients are kept, creating essential oil in the form of gas at the top of the container. After that, the vaporized oil, along with some steam, travels through the second pipe to get to another container called the condenser.
Following that stage, a coiled pipe is placed inside the condenser. When the steam and vaporized essential oil travel through this pipe, they turn into liquid again. Finally, the essential oil is separated from the condensed water and each of the components is ready to be used for different purposes, catering for consumers’ needs.
Từ vựng:
- involve (v): bao gồm
- vaporize (v): làm bốc hơi
- condense(v): ngưng tụ -> condenser (n) bình ngưng tụ
- extract (v): chiết xuất
- airtight(adj): kín hơi > airtight container (n)
- tank (n): bể nước
- cater for (v): phục vụ, đáp ứng nhu cầu
Dịch bài mẫu:
Sơ đồ dưới đây cho thấy cách dầu được sử dụng trong quá trình sản xuất nước hoa.
Sơ đồ minh họa quy trình sản xuất nước hoa từ dầu. Nhìn chung, quy trình này gồm bốn bước chính: đun nóng, làm bay hơi, ngưng tụ và chiết xuất.
Ở giai đoạn đầu của quy trình, nước được đun nóng bằng lửa trong một thùng kín cho đến khi chuyển thành hơi nước. Sau đó, hơi nước đi qua một đường ống dẫn đến một bồn chứa lớn. Ở bước tiếp theo, các nguyên liệu thảo mộc tươi được đặt vào khoang giữa của một xi-lanh lớn. Đáy của xi-lanh này được nối với ống dẫn hơi nước, trong khi phần trên được kết nối với một ống khác. Khi hơi nước đi vào thùng chứa, nó đi qua khu vực chứa nguyên liệu, tạo ra tinh dầu dưới dạng khí ở phần trên của thùng chứa. Sau đó, tinh dầu bay hơi cùng một phần hơi nước tiếp tục đi qua ống dẫn thứ hai để đến một thùng chứa khác gọi là bộ ngưng tụ.
Tiếp theo, một ống cuộn được đặt bên trong bộ ngưng tụ. Khi hơi nước và tinh dầu bay hơi đi qua ống này, chúng được làm lạnh và chuyển hóa lại thành dạng lỏng. Cuối cùng, tinh dầu được tách ra khỏi nước đã ngưng tụ và mỗi thành phần sẽ được sử dụng cho các mục đích khác nhau, nhằm đáp ứng nhu cầu của người tiêu dùng.
Bài mẫu IELTS Writing Task 1 dạng Mixed Chart
Đề bài:
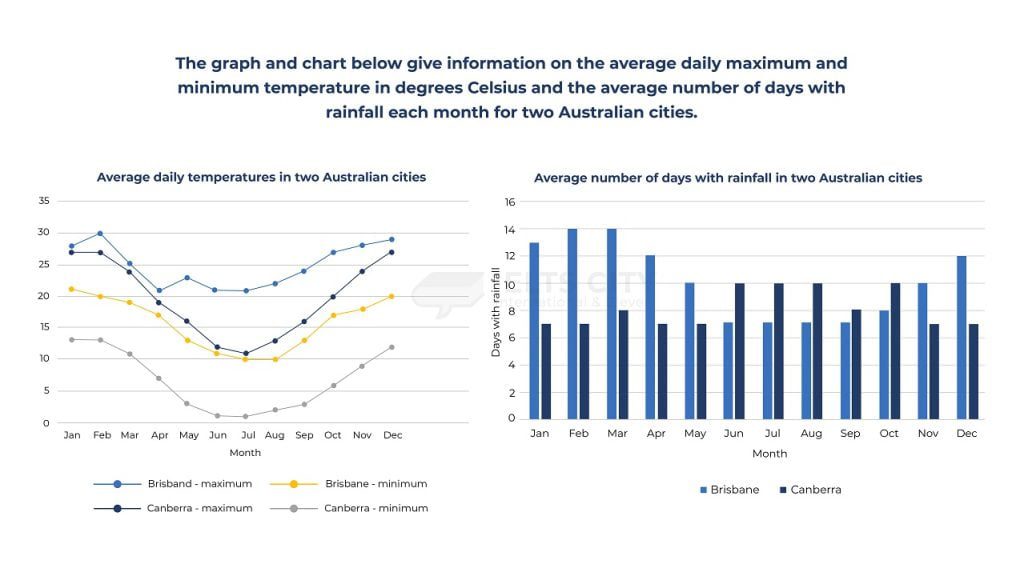
The graph and chart below give information on the average daily maximum and minimum temperature in degrees Celsius and the average number of days with rainfall each month for two Australian cities.
Dàn bài:
- Introduction: Paraphrase đề bài.
- The graph and chart below → the charts (bỏ “below”).
- Give information on → compare.
- The average daily maximum and minimum temperatures in degrees Celsius → the lows and highs in average daily temperatures (°C).
- And → as well as.
- The average number of days with rainfall → the average number of rainy days.
- Each month → during a year.
- For two Australian cities → between two Australian cities, Brisbane and Canberra.
⇒ The charts / compare / the lows and highs in average daily temperatures (°C) / as well as / the average number of rainy days / during a year / between two Australian cities, Brisbane and Canberra.
- Overview: Mô tả khái quát biểu đồ bằng cách nhận xét những đặc điểm nổi bật nhất (3–4 ý).
- Brisbane ấm hơn nhiều so với Canberra.
- Điểm chung: nhiệt độ có xu hướng cao hơn vào quý đầu tiên và cuối cùng của năm.
- Lượng mưa, nhìn chung, Brisbane có nhiều ngày mưa hơn Canberra, ngoại trừ từ tháng 6 đến tháng 10.
- Details: Mô tả một cách cụ thể mỗi đối tượng, dẫn số liệu và so sánh khi cần thiết.
- Paragraph 1: Nhiệt độ trung bình.
- Paragraph 2: Số ngày mưa trung bình.
Bài mẫu:
The charts compare the lows and highs in average daily temperatures (°C) as well as the average number of rainy days during a year between two Australian cities, Brisbane and Canberra.
The statistics reflect that Brisbane is much warmer than Canberra. However, they both have in common that their temperatures tend to be higher in the first and last quarters of the year. As for rainfall, Brisbane generally experiences more rainy days than Canberra, except between June and October.
Maximum temperatures in Brisbane peak in February (30°C) and December (28°C), lowering towards June and July (21°C). Canberra’s warmest months also coincide with Brisbane’s, although the temperature is not as high (27°C). Nevertheless, in June and July, Canberra’s maximums (11–12°C) almost equal Brisbane’s minimums (10–11°C), while its minimums even get close to freezing point (1–2°C).
At its summit, Brisbane records up to 13–14 days of rainfall in the first quarter, while Canberra shows only half of that figure. In April, May, November, and December, the gap lessens, yet Brisbane’s figures (10–12) are still significantly higher than Canberra’s (7). Only from June to October does the reverse happen: Canberra experiences 8–10 days of rainfall compared to 7–8 days in Brisbane.
Từ vựng:
- Statistics [n]: a collection of information shown in numbers (số liệu thống kê).
- Have something in common (with something) [idiom]: (of things, places, etc.) to have the same features, characteristics, etc.
- Quarter [n]: a period of three months, used especially as a period for which bills are paid or a company’s income is calculated (một quý trong năm).
- Peak [v]: to reach the highest point or value (đạt mốc cao nhất).
- Lower [v]: to reduce something or to become less in value, quality, etc. (hạ thấp).
- Coincide (with something) [v]: (of two or more events) to take place at the same time (trùng với).
- Freezing point [n]: 0° Celsius, the temperature at which water freezes (điểm đóng băng).
- Summit [n]: the highest point of something, especially the top of a mountain (đỉnh điểm).
- Record [v]: to show a particular measurement or amount (ghi nhận).
- Lessen [v]: to become or make something become smaller, weaker, less important, etc. (giảm đi).
- The reverse [n]: the opposite of what has just been mentioned (điều ngược lại).
Dịch bài mẫu:
Các biểu đồ so sánh mức thấp nhất và cao nhất về nhiệt độ trung bình hàng ngày cũng như số ngày mưa trung bình trong một năm giữa hai thành phố của Úc, Brisbane và Canberra.
Các số liệu thống kê phản ánh rằng Brisbane ấm hơn nhiều so với Canberra. Tuy nhiên, cả hai đều có điểm chung là nhiệt độ có xu hướng cao hơn vào quý đầu tiên và cuối cùng của năm. Về lượng mưa, nhìn chung, Brisbane trải qua nhiều ngày mưa hơn Canberra, ngoại trừ từ tháng 6 đến tháng 10.
Nhiệt độ tối đa ở Brisbane cao nhất vào tháng 2 (30°C) và tháng 12 (28°C), hạ thấp vào tháng 6 và tháng 7 (21°C). Những tháng ấm nhất của Canberra cũng trùng với Brisbane, mặc dù nhiệt độ không cao bằng (27°C). Tuy nhiên, vào tháng 6 và tháng 7, nhiệt độ tối đa của Canberra (11–12°C) gần như bằng với nhiệt độ tối thiểu của Brisbane (10–11°C), trong khi nhiệt độ tối thiểu của nó thậm chí còn gần với điểm đóng băng (1–2°C).
Tại đỉnh điểm, Brisbane ghi nhận lượng mưa lên tới 13–14 ngày trong quý đầu tiên, trong khi Canberra chỉ cho thấy một nửa con số đó. Vào tháng 4, tháng 5, tháng 11 và tháng 12, khoảng cách giảm bớt, nhưng số liệu của Brisbane (10–12) vẫn cao hơn đáng kể so với của Canberra (7). Chỉ từ tháng 6 đến tháng 10, điều ngược lại mới xảy ra: Canberra trải qua 8–10 ngày mưa so với 7–8 ngày ở Brisbane.
Cập nhật đề Writing Task 1 mới nhất tại:
Cảm ơn các bạn đã dành thời gian tham khảo hết các bài mẫu IELTS Writing Task 1 band 7.5+ của IELTS CITY. Hy vọng các bài mẫu trên sẽ giúp bạn nắm cách triển khai ý trả lời hiệu quả cho các dạng trong IELTS Writing Task 1. Chúc các bạn luyện thi IELTS Writing Task 1 hiệu quả và sớm đạt Target nhé!