Đề thi IELTS Writing Task 1 ngày 24.08.2024 là đề dạng Table về lượng tiêu thụ thực phẩm tại một quốc gia châu Âu. Để xử lý tốt đề bài này, các bạn hãy tham khảo dàn ý và bài mẫu 7.5+ được soạn bởi IELTS CITY phía sau nhé!
Đề thi IELTS Writing Task 1 ngày 24.08.2024
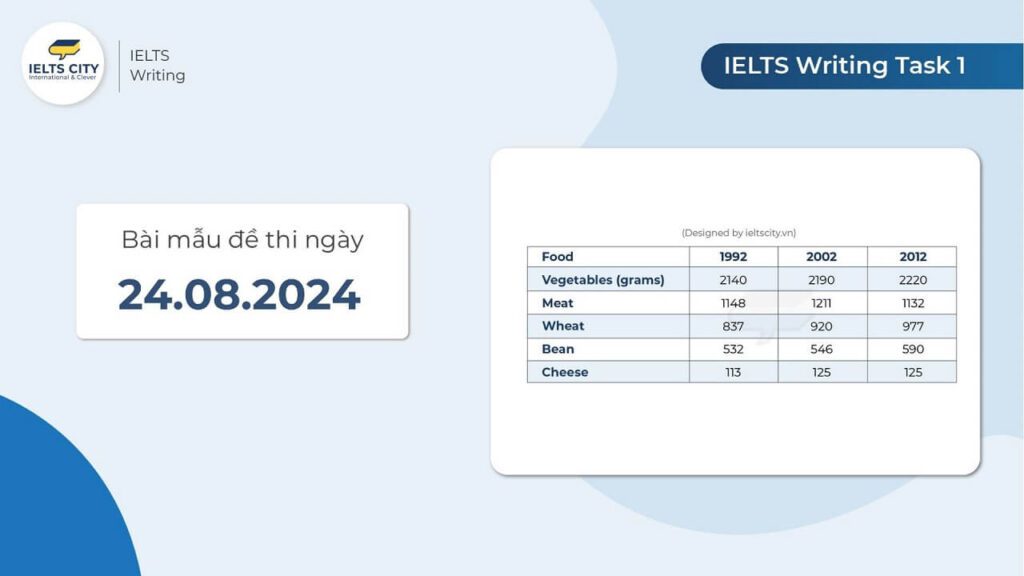
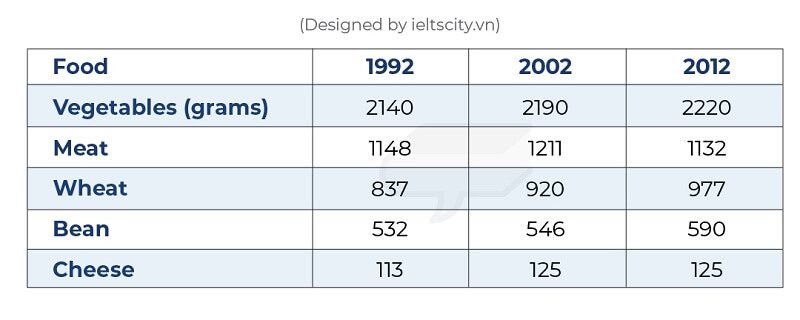
The table below presents the food consumption per person weekly in a European country in 1992, 2002 and 2012. Summarize the information by selecting and reporting the main features and make comparisons where relevant.
Dàn ý
- Introduction:
- Paraphrase the question by stating that the table shows food consumption per person per week in a European country over three years: 1992, 2002, and 2012.
- Overview:
- Mention the general trends: Vegetables had the highest consumption in all three years, while Cheese remained the least consumed. Wheat and Bean consumption gradually increased, while Meat saw some fluctuations.
- Body Paragraph 1 (Higher-consumption categories):
- Discuss the trends in Vegetables, Wheat, and Beans consumption, focusing on the steady rise over time.
- Body Paragraph 2 (Lower-consumption categories):
- Explain the trends in Meat and Cheese consumption, highlighting the fluctuations and stable figures.
Hướng dẫn: Cách viết IELTS Writing Task 1 chi tiết từ A-Z
Sample Answer 7.5+
The table illustrates the weekly food consumption per person in a European country across three years: 1992, 2002, and 2012, with the data measured in grams.
Overall, Vegetables consistently had the highest consumption, showing a slight but steady increase over the 20-year period. In contrast, Cheese was the least consumed food, and its figures remained stable between 2002 and 2012. While Wheat and Bean consumption grew progressively, Meat saw fluctuations with a peak in 2002 before slightly decreasing by 2012.
Vegetables were consumed the most among all the food categories, starting at 2,140 grams per person per week in 1992, rising slightly to 2,190 grams in 2002, and reaching 2,220 grams by 2012. Wheat also showed a notable increase, with consumption rising from 837 grams in 1992 to 977 grams in 2012, marking a consistent upward trend. Similarly, the consumption of Beans followed a gradual rise, growing from 532 grams in 1992 to 590 grams in 2012.
On the other hand, Meat consumption fluctuated over the three decades. It began at 1,148 grams per person per week in 1992, peaked at 1,211 grams in 2002, but then dropped to 1,132 grams by 2012. Cheese consumption remained the most stable, increasing from 113 grams in 1992 to 125 grams in 2002, after which it stayed unchanged in 2012.
Từ vựng
- Illustrate (v): Minh họa
- Steady (adj): Đều đặn
- Progressively (adv): Dần dần
- Fluctuate (v): Dao động
- Stable (adj): Ổn định
- Consistently (adv): Liên tục
- Peak (v): Đạt đỉnh
- Notable (adj): Đáng chú ý
- Consumption (n): Tiêu thụ
- Upward trend (n): Xu hướng tăng
Bỏ túi ngay: Tổng hợp từ vựng IELTS Writing Task 1 thông dụng nhất!
Bản dịch
Bảng mô tả lượng tiêu thụ thực phẩm hàng tuần trên đầu người ở một quốc gia châu Âu qua ba năm: 1992, 2002 và 2012, với số liệu đo bằng gam.
Nhìn chung, Rau quả luôn có mức tiêu thụ cao nhất và tăng nhẹ nhưng đều đặn trong suốt 20 năm. Ngược lại, Phô mai là loại thực phẩm được tiêu thụ ít nhất, và con số này ổn định giữa năm 2002 và 2012. Trong khi lượng tiêu thụ Lúa mì và Đậu dần tăng lên, thì Thịt có sự dao động, đạt đỉnh vào năm 2002 trước khi giảm nhẹ vào năm 2012.
Rau quả được tiêu thụ nhiều nhất trong tất cả các loại thực phẩm, bắt đầu ở mức 2.140 gam trên đầu người mỗi tuần vào năm 1992, tăng nhẹ lên 2.190 gam vào năm 2002, và đạt 2.220 gam vào năm 2012. Lượng tiêu thụ Lúa mì cũng cho thấy sự gia tăng đáng kể, từ 837 gam vào năm 1992 lên 977 gam vào năm 2012, đánh dấu một xu hướng tăng ổn định. Tương tự, lượng tiêu thụ Đậu cũng tăng dần, từ 532 gam vào năm 1992 lên 590 gam vào năm 2012.
Mặt khác, lượng tiêu thụ Thịt dao động trong ba thập kỷ. Nó bắt đầu ở mức 1.148 gam trên đầu người mỗi tuần vào năm 1992, đạt đỉnh 1.211 gam vào năm 2002, nhưng sau đó giảm xuống còn 1.132 gam vào năm 2012. Lượng tiêu thụ Phô mai vẫn ổn định nhất, tăng từ 113 gam vào năm 1992 lên 125 gam vào năm 2002, và sau đó không thay đổi vào năm 2012.
Theo dõi đề thi IELTS Writing mới nhất tại:
Cảm ơn các bạn đã theo dõi hết bài mẫu đề thi IELTS Writing Task 1 ngày 24.08.2024 dạng Table band 7.5+ được biên soạn bởi IELTS CITY. Hy vọng sau bài mẫu này, các bạn đã nắm được cách phân tích số liệu và cách triển khai ý tưởng hiệu quả. Chúc các bạn luyện IELTS hiệu quả và sớm đạt Target trong lần thi tới nhé!