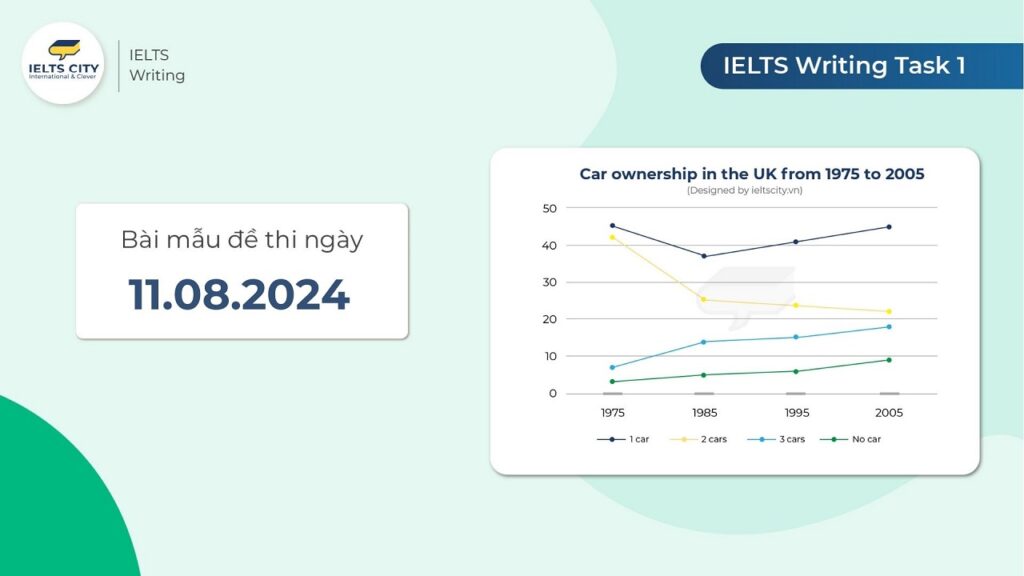
Đề thi IELTS Writing Task 1 ngày 11.08.2024 là đề dạng Line Graph về số lượng xe hơi đã sở hữu tại UK từ 1975 – 2005. Để xử lý tốt đề này, các bạn hãy cùng IELTS CITY tham khảo bài mẫu 7.5+ phía sau nhé!
Nội dung chính
ToggleĐề thi IELTS Writing Task 1 ngày 11.08.2024
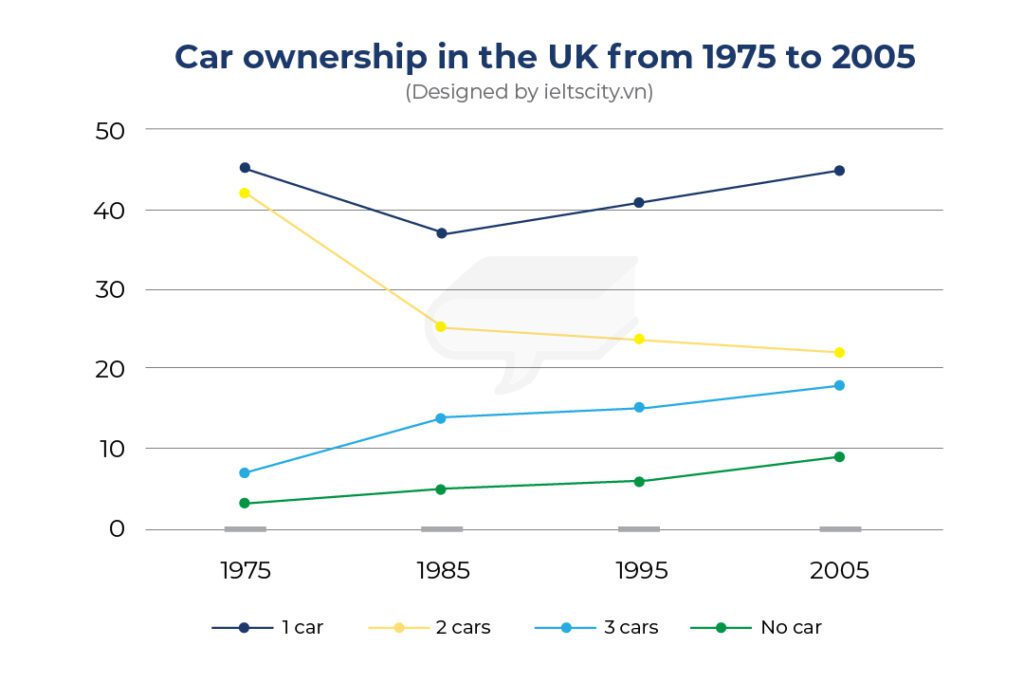
The chart below gives information about car ownership in the UK from 1975 to 2005. Summaries the information by selecting and reporting the main features and make comparisons where relevant.
Dàn ý
Introduction:
- Paraphrase: The graph shows the percentage of car ownership in the UK from 1975 to 2005.
Overview:
- Mention the key trends:
- The percentage of people owning 1 car and 3 cars increased over the years.
- The percentage of people owning 2 cars and those without a car showed a downward trend.
Body Paragraph 1 (1 car & 2 cars):
- Describe the steady increase in 1-car households from 1975 to 2005.
- Explain the significant decline in households with 2 cars over the same period.
Body Paragraph 2 (No car & 3 cars):
- Describe the gradual decline in the percentage of households with no cars.
- Highlight the steady but slower increase in the number of households owning 3 cars.
Hướng dẫn: Cách viết IELTS Writing Task 1
Sample Answer 7.5+
The line graph illustrates the percentage of car ownership in the UK over a 30-year period, from 1975 to 2005. The data is divided into four categories: people owning 1 car, 2 cars, 3 cars, and no car.
Overall, there was a clear increase in the number of people owning one or three cars, while those without a car or with two cars experienced a decline over the period.
In 1975, the majority of UK citizens owned either one or two cars, with 43% of the population having 1 car and approximately 38% owning 2 cars. Over the next three decades, the figure for 1-car households rose steadily, peaking at about 47% in 2005. Conversely, the percentage of those with two cars fell significantly to around 27% in the same year.
Meanwhile, the proportion of people with no car or three cars started at a lower base. In 1975, roughly 8% of households had no car, and around 4% owned 3 cars. Over the years, the share of non-car owners steadily decreased to about 5%, whereas the percentage of those owning 3 cars saw a moderate rise to 12% by 2005.
Từ Vựng
- Percentage (n): Phần trăm
- Ownership (n): Quyền sở hữu
- Steadily (adv): Một cách ổn định
- Proportion (n): Tỷ lệ
- Moderate (adj): Vừa phải
- Decline (n): Sự suy giảm
- Significantly (adv): Đáng kể
- Peak (v): Đạt đỉnh
- Household (n): Hộ gia đình
- Conversely (adv): Ngược lại
Bản dịch
Biểu đồ đường minh họa tỷ lệ sở hữu ô tô ở Anh trong khoảng thời gian 30 năm, từ 1975 đến 2005. Dữ liệu được chia thành bốn loại: những người sở hữu 1 ô tô, 2 ô tô, 3 ô tô và không có ô tô.
Nhìn chung, có sự gia tăng rõ rệt về số lượng người sở hữu một hoặc ba ô tô, trong khi những người không sở hữu ô tô hoặc có hai ô tô lại giảm trong suốt giai đoạn này.
Năm 1975, phần lớn người dân Anh sở hữu một hoặc hai xe, với 43% dân số có 1 xe và khoảng 38% sở hữu 2 xe. Trong ba thập kỷ tiếp theo, số liệu về các hộ gia đình có 1 xe tăng đều, đạt đỉnh khoảng 47% vào năm 2005. Ngược lại, tỷ lệ những người có hai xe giảm đáng kể xuống còn khoảng 27% trong cùng năm.
Trong khi đó, tỷ lệ người không có xe hoặc có ba xe bắt đầu từ một cơ sở thấp hơn. Năm 1975, khoảng 8% hộ gia đình không có xe và khoảng 4% sở hữu 3 xe. Qua các năm, tỷ lệ không có xe giảm đều đặn xuống còn khoảng 5%, trong khi tỷ lệ những người sở hữu 3 xe tăng vừa phải lên 12% vào năm 2005.
Cập nhật đề thi IELTS Writing đầy đủ nhất:
Cảm ơn các bạn đã theo dõi hết bài mẫu đề thi IELTS Writing Task 1 ngày 11.08.2024 dạng Line Graph band 7.5+ được biên soạn bởi IELTS CITY. Chúc các bạn luyện thi IELTS hiệu quả và sớm đạt Target nhé!


