Đề thi IELTS Writing Task 1 ngày 01.09.2024 là đề dạng Mixed-chart (Bao gồm Line grap và Table) về tỉ lệ sinh viên có việc sau khi tốt nghiệp và lương của họ. Để viết tốt đề bài này, các bạn hãy cùng IELTS CITY tham khảo dàn ý và bài mẫu phía sau nhé!
Đề thi IELTS Writing Task 1 ngày 01.09.2024
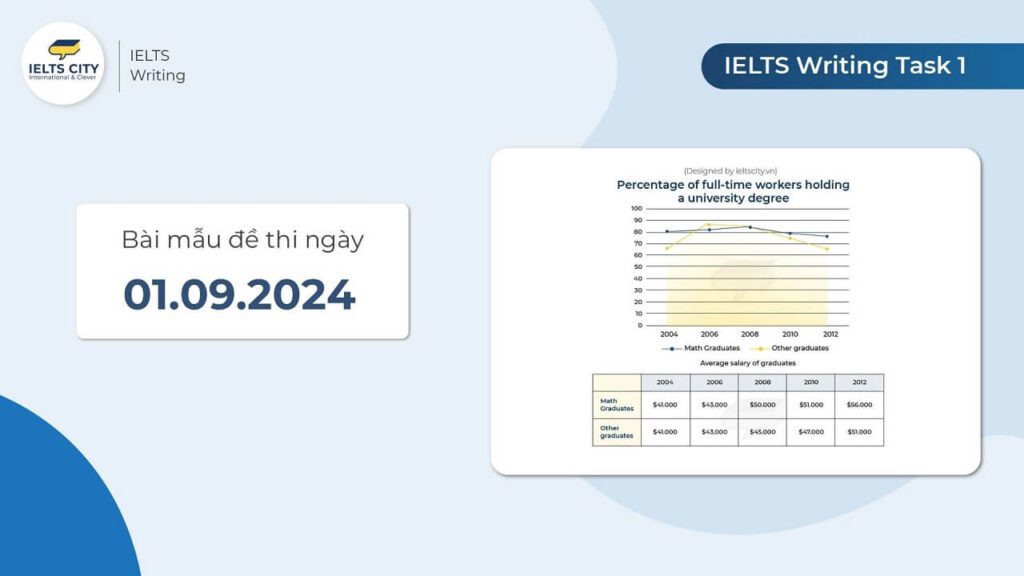
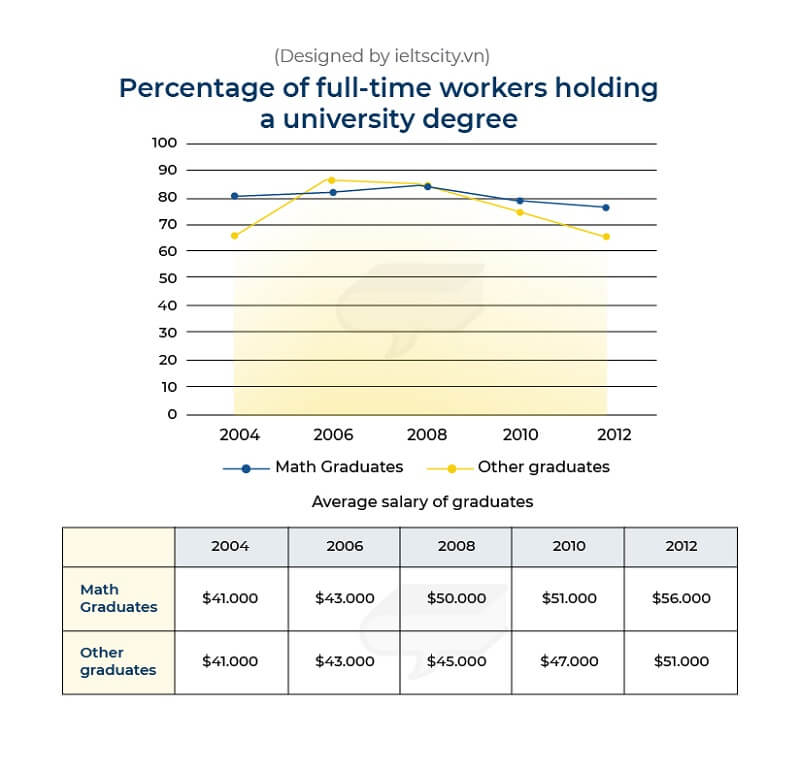
The graphs below show the percentage of graduates that got full-time jobs after graduating from a university in Australia, and the average salary of both these types of graduates, from 2004 to 2012. Summarize the information by selecting and reporting the main features, and make comparisons where relevant.
Dàn ý
- Introduction: Paraphrase the question, mentioning both the line graph showing the percentage of math and other graduates in full-time employment from 2004 to 2012, and the table displaying the average salaries for both groups over the same period.
- Overview: Highlight the main trends, such as the generally higher employment rates for math graduates compared to other graduates, as well as the rising salaries for both groups, particularly for math graduates.
- Body Paragraph 1: Discuss the percentage of math graduates and other graduates securing full-time jobs across the years, noting key trends and comparisons.
- Body Paragraph 2: Examine the trends in average salaries for both math and other graduates, emphasizing the differences and growth over time.
Hướng dẫn: Cách viết IELTS Writing Task 1 chi tiết từ A-Z
Sample Answer 7.5+
The line graph compares the percentage of math graduates and other graduates who secured full-time employment between 2004 and 2012, while the table shows their respective average salaries over the same period.
Overall, math graduates consistently had higher full-time employment rates than other graduates, although both groups saw a general decline in employment over the years. In terms of salaries, both math and other graduates experienced steady growth, with math graduates enjoying a significantly larger increase by 2012.
In 2004, approximately 80% of math graduates were employed full-time, compared to around 70% of other graduates. By 2006, both groups saw an increase, with math graduates peaking at about 90%, and other graduates reaching roughly 80%. However, after 2006, the employment rates for both groups started to decline. By 2012, the percentage of math graduates in full-time employment had dropped to just under 80%, while the figure for other graduates fell to around 60%, marking a more significant drop for the latter group.
When it comes to salaries, math graduates started with an average of $41,000 in 2004, which was identical to that of other graduates. However, math graduates experienced a sharper rise in earnings, reaching $56,000 in 2012, whereas the salaries of other graduates increased more modestly, standing at $51,000 by the end of the period. The gap in earnings between the two groups gradually widened over the years, with math graduates enjoying higher financial rewards by 2012.
Từ vựng
- Consistently (adv): Liên tục
- Secure (v): Đảm bảo được
- Steady (adj): Ổn định
- Modestly (adj): Nhẹ, khiêm tốn
- Significantly (adv): Đáng kể
- Peak (v): Đạt đỉnh
- Sharp (adj): Mạnh mẽ
- Widen (v): Mở rộng
- Financial rewards (n): Phần thưởng tài chính
Bỏ túi ngay: Tổng hợp từ vựng IELTS Writing Task 1 thông dụng nhất
Bản dịch
Biểu đồ đường so sánh tỷ lệ sinh viên tốt nghiệp ngành toán và các ngành khác có được việc làm toàn thời gian trong giai đoạn từ 2004 đến 2012, trong khi bảng dữ liệu hiển thị mức lương trung bình của họ trong cùng giai đoạn.
Nhìn chung, sinh viên tốt nghiệp ngành toán luôn có tỷ lệ làm việc toàn thời gian cao hơn so với các sinh viên khác, mặc dù cả hai nhóm đều chứng kiến sự giảm sút về việc làm trong những năm qua. Về mức lương, cả sinh viên ngành toán và các ngành khác đều có sự tăng trưởng ổn định, với sinh viên ngành toán đạt mức tăng lớn hơn đáng kể vào năm 2012.
Năm 2004, khoảng 80% sinh viên tốt nghiệp ngành toán có việc làm toàn thời gian, so với khoảng 70% của các sinh viên khác. Đến năm 2006, cả hai nhóm đều có sự gia tăng, với sinh viên ngành toán đạt đỉnh khoảng 90%, và các sinh viên khác đạt khoảng 80%. Tuy nhiên, sau năm 2006, tỷ lệ việc làm của cả hai nhóm bắt đầu giảm dần. Đến năm 2012, tỷ lệ sinh viên tốt nghiệp ngành toán có việc làm toàn thời gian giảm xuống còn dưới 80%, trong khi con số này của các sinh viên khác giảm xuống khoảng 60%, đánh dấu sự sụt giảm lớn hơn đối với nhóm này.
Về mức lương, sinh viên tốt nghiệp ngành toán bắt đầu với mức trung bình là $41,000 vào năm 2004, tương tự với các sinh viên khác. Tuy nhiên, sinh viên ngành toán chứng kiến mức tăng mạnh hơn về thu nhập, đạt $56,000 vào năm 2012, trong khi mức lương của các sinh viên khác tăng nhẹ hơn, đạt $51,000 vào cuối giai đoạn. Khoảng cách về thu nhập giữa hai nhóm ngày càng mở rộng theo thời gian, với sinh viên ngành toán hưởng lợi nhiều hơn về tài chính vào năm 2012.
Cập nhật đề thi IELTS Writing mới nhất tại:
Cảm ơn các bạn đã tham khảo bài mẫu đề thi IELTS Writing Task 1 ngày 01.09.2024 dạng Mixed-chart band 7.5+ được biên soạn bởi IELTS CITY. Hy vọng với dàn ý và bài mẫu trên sẽ giúp các bạn nắm cách phân tích biểu đồ và triển khai ý tốt nhất cho đề này nhé. Chúc các bạn luyện IELTS thành công và sớm đạt Target!